-
I began this project with a deceptively simple question: how often do I press the power button on my window air‑conditioner and what specific yet subjective personal or environmental cues persuade me to do so? Almost thirty spring days of meticulous logging every interaction between myself and my A/C between 28 March and 22 April 2025 provided the raw material for me to explore just how complex this simple question was by making three visualizations.
Before interpreting the three following visualizations, readers need to understand the method of collection. I collected the data manually over seven consecutive days (28 March to 3 April 2025). Every single press of the ON/OFF button became a row in a Google Sheet, where I captured the exact date and time, whether the action turned the unit on or off, the fan speed or cooling mode chosen when the unit was activated, the indoor temperature read from a living‑room thermometer, the outdoor temperature taken from a local neighborhood weather app online, and the subjective reason I chose was from an eight‑item list that ranged from “Humidity” to “Too Cold.” I also grouped the timestamps into morning, afternoon, and evening blocks so that patterns by time of day would be simple to spot.
var divElement = document.getElementById(‘viz1745380683996’); var vizElement = divElement.getElementsByTagName(‘object’)[0]; vizElement.style.width=’100%’;vizElement.style.height=(divElement.offsetWidth*0.75)+’px’; var scriptElement = document.createElement(‘script’); scriptElement.src = ‘https://public.tableau.com/javascripts/api/viz_v1.js’; vizElement.parentNode.insertBefore(scriptElement, vizElement);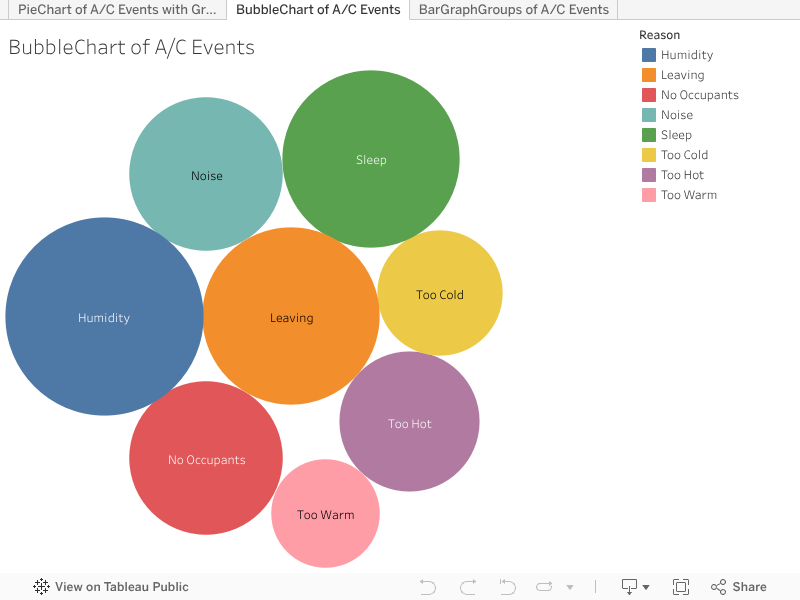
This bubble chart is the easiest way to introduce the data while also illustrating how vast the dataset is without overwhelming the reader with too many variables, although they are lurking beneath the visualization.
The next visualization is the pie chart, which really flexes how much data we have here – this pie chart is actually animated and has four groupings for users to start to digest – this is the main part of the dataset that we “created” in a sense, the groups were decided and you could always say that it was arbitrarily done. But, “Afternoon” as 12-5pm, “Evening” as 6-9pm, “Late Night” as 10-11pm, and “Morning” as 12am-11pm makes sense because I am usually asleep during most of the “Morning.” I also think we are basically testing bubbles against pie charts here, but I also wanted to add the wrinkle of having four pie charts essentially through the animation.
var divElement = document.getElementById(‘viz1745380437845’); var vizElement = divElement.getElementsByTagName(‘object’)[0]; vizElement.style.width=’100%’;vizElement.style.height=(divElement.offsetWidth*0.75)+’px’; var scriptElement = document.createElement(‘script’); scriptElement.src = ‘https://public.tableau.com/javascripts/api/viz_v1.js’; vizElement.parentNode.insertBefore(scriptElement, vizElement);
The pie chart also shows you the human element to all of this in a colorful way, which is that the “Sleep” reason goes up during the Late Night grouping, which also tells you what time I go to sleep. The fact that I do not always or even a majority of the time use the sleep reason to turn off the A/C at night shows you that I do in fact sleep with it on, which is not recommended.
var divElement = document.getElementById(‘viz1745380450314’); var vizElement = divElement.getElementsByTagName(‘object’)[0]; vizElement.style.width=’100%’;vizElement.style.height=(divElement.offsetWidth*0.75)+’px’; var scriptElement = document.createElement(‘script’); scriptElement.src = ‘https://public.tableau.com/javascripts/api/viz_v1.js’; vizElement.parentNode.insertBefore(scriptElement, vizElement);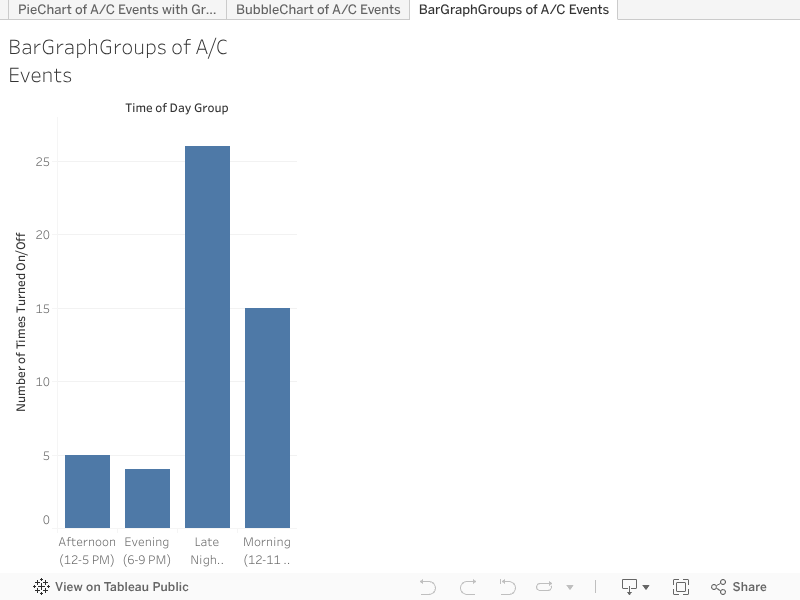
The bar chart towers at 26 toggles between 10 p.m. and 5 a.m., nearly half of the week’s total. I’m a light sleeper, and even a slight temperature drift or street noise makes me reach for the switch almost as a reflex. I also like the bar chart as the summary here because again, just seeing the grouping as separate pie charts does not allow you to compare the groupings, but then when we have the bar charts, that is the immediate clearest thing. We also did not show this in the bubble chart in the beginning so the user can decide which simple visualization impacted them more, the animated ones, or the simple ones.
Even so, for the reader and myself, the exercise has practical value. I now know that a quieter fan mode might curb my noise‑inspired toggling, a small dehumidifier run overnight could reduce how many times I press it in the morning, and a smart plug could be used to automatically shut power between noon and five o’clock, which would eliminate wasted electricity. If I extend the study, I will automate data collection with a connected switch, pair it with continuous temperature and humidity sensors, and look at hourly electricity rates to see what the economics are behind these on/off decisions, since my background is in economics. Other researchers could expand the scope to multiple apartments or seasons, but for me, I think the overall message is pretty simple, which is that by paying attention to the tiny habitual decisions I make each day, I have uncovered real ways to save energy and improve everyday comfort and the evidence is sprinkled throughout this post in the three visualizations.
-
I began this project with a deceptively simple question: how often do I press the power button on my window air‑conditioner and what specific yet subjective personal or environmental cues persuade me to do so? Almost thirty spring days of meticulous logging every interaction between myself and my A/C between 28 March and 22 April 2025 provided the raw material for me to explore just how complex this simple question was by making three visualizations.
Before interpreting the three following visualizations, readers need to understand the method of collection. I collected the data manually over seven consecutive days (28 March to 3 April 2025). Every single press of the ON/OFF button became a row in a Google Sheet, where I captured the exact date and time, whether the action turned the unit on or off, the fan speed or cooling mode chosen when the unit was activated, the indoor temperature read from a living‑room thermometer, the outdoor temperature taken from a local neighborhood weather app online, and the subjective reason I chose was from an eight‑item list that ranged from “Humidity” to “Too Cold.” I also grouped the timestamps into morning, afternoon, and evening blocks so that patterns by time of day would be simple to spot.
var divElement = document.getElementById(‘viz1745380683996’); var vizElement = divElement.getElementsByTagName(‘object’)[0]; vizElement.style.width=’100%’;vizElement.style.height=(divElement.offsetWidth*0.75)+’px’; var scriptElement = document.createElement(‘script’); scriptElement.src = ‘https://public.tableau.com/javascripts/api/viz_v1.js’; vizElement.parentNode.insertBefore(scriptElement, vizElement);This bubble chart is the easiest way to introduce the data while also illustrating how vast the dataset is without overwhelming the reader with too many variables, although they are lurking beneath the visualization.
The next visualization is the pie chart, which really flexes how much data we have here – this pie chart is actually animated and has four groupings for users to start to digest – this is the main part of the dataset that we “created” in a sense, the groups were decided and you could always say that it was arbitrarily done. But, “Afternoon” as 12-5pm, “Evening” as 6-9pm, “Late Night” as 10-11pm, and “Morning” as 12am-11pm makes sense because I am usually asleep during most of the “Morning.” I also think we are basically testing bubbles against pie charts here, but I also wanted to add the wrinkle of having four pie charts essentially through the animation.
var divElement = document.getElementById(‘viz1745380437845’); var vizElement = divElement.getElementsByTagName(‘object’)[0]; vizElement.style.width=’100%’;vizElement.style.height=(divElement.offsetWidth*0.75)+’px’; var scriptElement = document.createElement(‘script’); scriptElement.src = ‘https://public.tableau.com/javascripts/api/viz_v1.js’; vizElement.parentNode.insertBefore(scriptElement, vizElement);The pie chart also shows you the human element to all of this in a colorful way, which is that the “Sleep” reason goes up during the Late Night grouping, which also tells you what time I go to sleep. The fact that I do not always or even a majority of the time use the sleep reason to turn off the A/C at night shows you that I do in fact sleep with it on, which is not recommended.
var divElement = document.getElementById(‘viz1745380450314’); var vizElement = divElement.getElementsByTagName(‘object’)[0]; vizElement.style.width=’100%’;vizElement.style.height=(divElement.offsetWidth*0.75)+’px’; var scriptElement = document.createElement(‘script’); scriptElement.src = ‘https://public.tableau.com/javascripts/api/viz_v1.js’; vizElement.parentNode.insertBefore(scriptElement, vizElement);The bar chart towers at 26 toggles between 10 p.m. and 5 a.m., nearly half of the week’s total. I’m a light sleeper, and even a slight temperature drift or street noise makes me reach for the switch almost as a reflex. I also like the bar chart as the summary here because again, just seeing the grouping as separate pie charts does not allow you to compare the groupings, but then when we have the bar charts, that is the immediate clearest thing. We also did not show this in the bubble chart in the beginning so the user can decide which simple visualization impacted them more, the animated ones, or the simple ones.
Even so, for the reader and myself, the exercise has practical value. I now know that a quieter fan mode might curb my noise‑inspired toggling, a small dehumidifier run overnight could reduce how many times I press it in the morning, and a smart plug could be used to automatically shut power between noon and five o’clock, which would eliminate wasted electricity. If I extend the study, I will automate data collection with a connected switch, pair it with continuous temperature and humidity sensors, and look at hourly electricity rates to see what the economics are behind these on/off decisions, since my background is in economics. Other researchers could expand the scope to multiple apartments or seasons, but for me, I think the overall message is pretty simple, which is that by paying attention to the tiny habitual decisions I make each day, I have uncovered real ways to save energy and improve everyday comfort and the evidence is sprinkled throughout this post in the three visualizations.

This entry is licensed under a Creative Commons Attribution-NonCommercial-ShareAlike 4.0 International license.